[Originally published in 2013 as A preliminary age calibration for the post-glacial-maximum period]
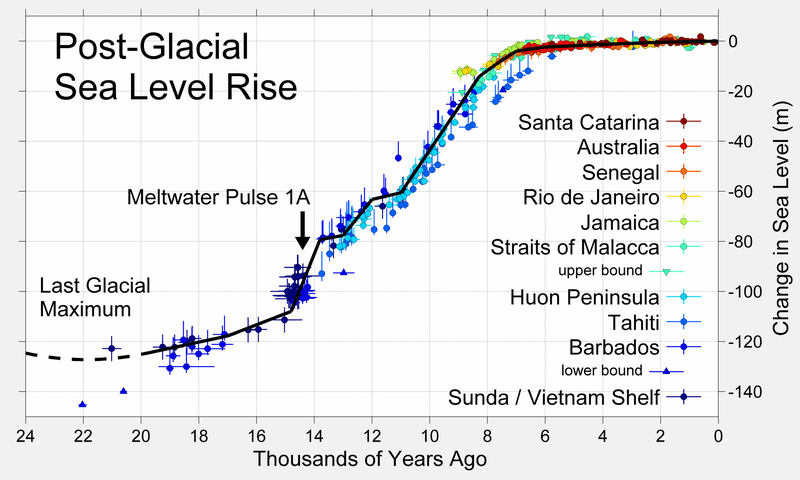
The sea-level curve on Wikipedia allows a rough calculation to be made to convert uniformitarian dates into actual dates for the post-Flood period:

We use Oard’s estimate for the timing of the post-Flood Ice Age (see figure 9 on the article about Banks Peninsula). He estimated it took 500 years for the Ice Age to reach its maximum after the Flood and 200 years for the ice to melt back at the end of the Ice Age maximum.
If we take the Flood at 4500 years ago (approximately), then the Ice Age maximum would be about 4000 years ago and the current sea levels were reached about 3800 years ago. On the Wikipedia image, therefore, we equate the last glacial maximum (22 ka ago) to the biblical age of 4,000 years ago. And we tie the point on the graph where the sea level reached the present level (7 ka ago) to the biblical age of 3800 years ago.
This is a very tight compression of time in this 200-year period.

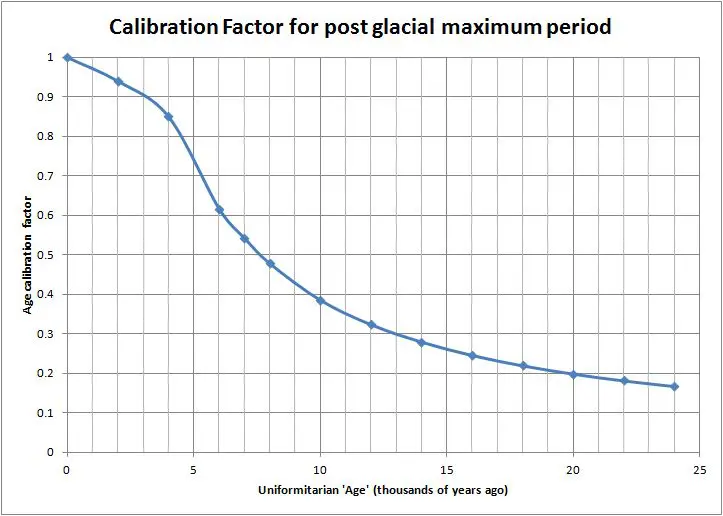
When we do this, we obtain the calibration factor shown in the second figure as a function of uniformitarian ‘age’. This calibration curve likely reflects the sorts of adjustments that would need to be made to carbon-14 ‘dates’ in order to obtain actual dates.
While this is a general calibration curve, I would anticipate there to be temporal and regional anomalies. The ‘ages’ connected with the sea-level curve shown on Wikipedia are most likely to have been measured by the carbon-14 method, and that can be affected by many factors, including the revegetation after the Flood, volcanism, and changes to the magnetic field of the earth.
I also suspect the melting of the ice sheets on the continents had some effect. (See What about carbon dating?)
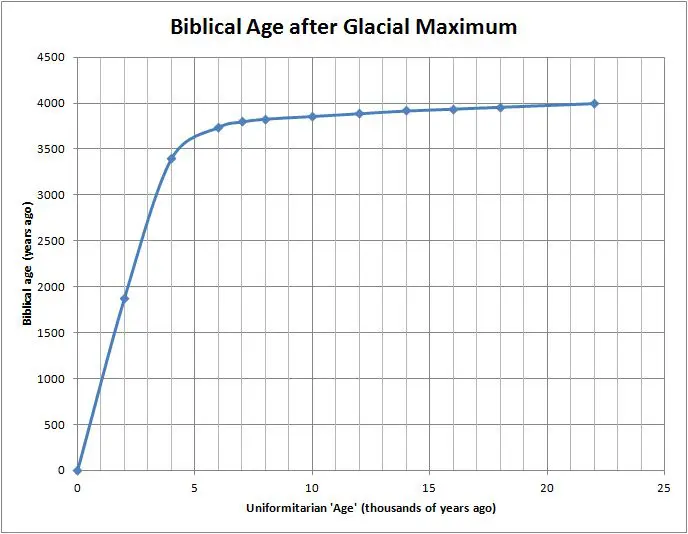
The third figure allows us to read off the biblical age for the post-glacial-maximum period when we have the uniformitarian age.

What we have done is arbitrarily adjusted the results to fit in with what we consider to be the reliable ages based on the historical reports in the Bible. Some may claim this is circular reasoning, and it is, or that I have massaged the figures to get the answer I want, and I have.
However, that is the way that all dating methods work. The researcher will do the measurements and calculations to work out the ‘age’. They will then compare this with what they think it should be. And when it does not agree, they will work out a way of adjusting the figures to get what they want.
This is actually what has been done with carbon-14, in that the results did not agree with other methods so there has been a calibration curve produced to make the results match with what they expect them to be. What I have done here is no different. I have matched the results with some of the points that I consider can be established with some degree of reliability.
This is a ‘back of the envelope’ calculation that provides an initial estimate for the sorts of corrections that need to be made, but we would need to consult more reliable sources and obtain other information in order to refine and test the curve. As we consider the form of the calibration function, it will help us explore the sorts of factors that may be affecting the carbon-14 ratio in the atmosphere in the past and develop research projects to explore these effects.


