[Originally published in 2016 as More “Ancient” DNA Found]
I read a fascinating paper published in Geology, the peer-reviewed journal of the Geological Society of America. The authors of the paper report on their attempts to extract DNA from the sediments found at the bottom of the Bering Sea. They were successful in their attempts to find DNA, even in sediments that are supposed to be 1.4 million years old! This is a rather surprising discovery since the half-life of DNA in bone is supposed to be about 521 years. In fact, the experiments done to obtain that half-life indicate that even at very low temperatures, no meaningful DNA could be extracted from bone after 1.5 million years.
So why is it surprising that the authors of this study found DNA in sediments that are supposed to be “only” 1.4 million years old? There are at least two reasons. First, wet sediment should accelerate the decay of biological molecules (including DNA) compared to the inside of a bone. Thus, DNA should become undetectable much earlier in wet sediment. Second, their results indicate that there would still be DNA found in much “older” sediments because the “older” the sediment in their study, the more the DNA seems to resist decay.
But wait a minute. This is wet sediment. All manner of microorganisms can infiltrate wet sediment. How do we know that this DNA has really been in the sediment since it was formed? Couldn’t the DNA they detected be from microorganisms that recently started living there?
That’s one of the clever aspects of this experiment. The authors looked at DNA that is found in the chloroplasts of cells that do photosynthesis! Since such organisms require light to survive, they wouldn’t have any reason to infiltrate the dark sediments. Even if they did get into those sediments for some reason, they would die in the upper layers, so the deeper (and therefore older) sediments definitely would not harbor any recent microorganisms that had such DNA.
In the end, it seems to me that they really did extract from the sediment DNA that had been there since that sediment formed. That’s interesting enough, but there is something even more fascinating about what the authors found.
Calibrating the Data Points
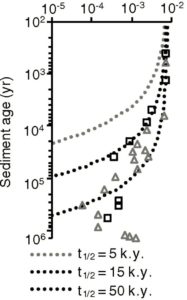
 The graph on the left is a slightly modified version of the authors’ Figure 3A. It shows the fraction of chloroplast DNA found versus the assumed age of the sediment. The squares represent what was found in sediment from one site, while the triangles represent what was found in sediment from another site. The various dotted curves show what one would expect if the DNA was decaying the way a biological compound typically decays. They each use a different half-life (5,000 years, 15,000 years, or 50,000 years), but they allow you to compare the data to what is expected based on our knowledge of how DNA decays. Notice that the data don’t follow any of the curves. The “older” the sediment, the “slower” the DNA seems to decay.
The authors note this:
As described in the Results section, for both sites, the relationship of cpDNA sequence fractions to age best fits a power law (Fig. 3B). This suggests that residual cpDNA is more resistant to degradation in older sediment.
(NOTE: “cpDNA” is their abbreviation for the DNA found in chloroplasts)
The authors suggest that perhaps the older the sediment, the lower the activity from bacteria and other dark-loving microorganisms. That might decrease the rate of DNA decay. Also, they suggest that perhaps some of the DNA is better protected than the rest. For example, some algae (the diatoms) form cell walls made from silica. Theoretically, their DNA should be more resistant to decay than the DNA found in algae that don’t make such cell walls. So maybe the DNA is not decaying as expected because there are several different rates of DNA decay in the sediment, and the only thing they can see is the mixture of all those rates.
I find both of those possible explanations unsatisfactory.
The first one is almost certainly not right because deep sediments support a wide variety of microbial life. The second one probably isn’t right, either. The authors specifically say that chloroplast DNA from diatoms is present in the deeper layers. At some point, you should get to sediment that is old enough that the poorly-protected DNA has decayed away and mostly diatom DNA is left. At that point, the data should follow one of the curves. However, the data never end up following the curves, even in the very “old” sediment.
There is another way to explain what the authors see
If the age of the sediment is calculated wrongly, you wouldn’t expect the data to follow the curves. To me, that’s the more likely explanation. However, more studies will need to be done to figure this out. For example, it would be interesting to see the same kind of graph made exclusively for chloroplast DNA from diatoms. This should give us results for only the better-protected DNA. If my interpretation of the data is correct, you still wouldn’t see anything like the expected decay pattern.
I hope that the authors (as well as others) continue this very interesting line of inquiry.


