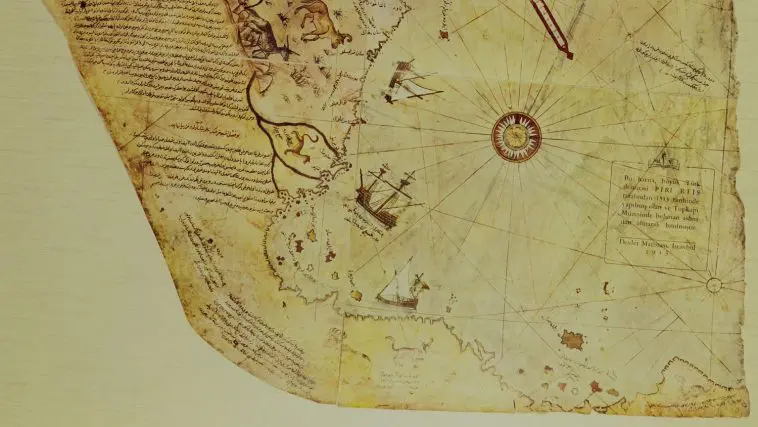
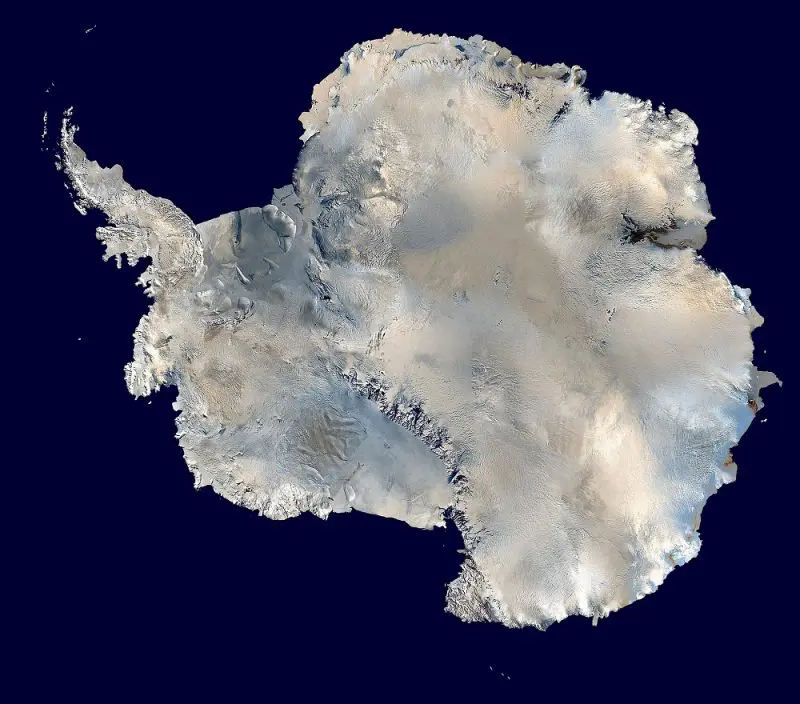
The Piri Reis map of 1513 is controversially claimed to show Antarctica’s Queen Maud Land coast, decades before it was discovered. Further, some claim that it shows an ice-free Antarctic coast. In trying to determine whether there was any truth to the claims, I checked the Antarctic coast on Google Earth. What I found was that Piri Reis included a peninsula that looks much like Cape Adare in Antarctica, although it is nearly halfway around the world from where it actually exists.
Piri Reis shows a large cape shaped like a duck looking west, and this is the only cape like it on the Piri Reis world map. Google Earth and the USGS earthquake web page show a large cape shaped like a duck looking northwest, and this is the only cape like it on either satellite-image-based world map.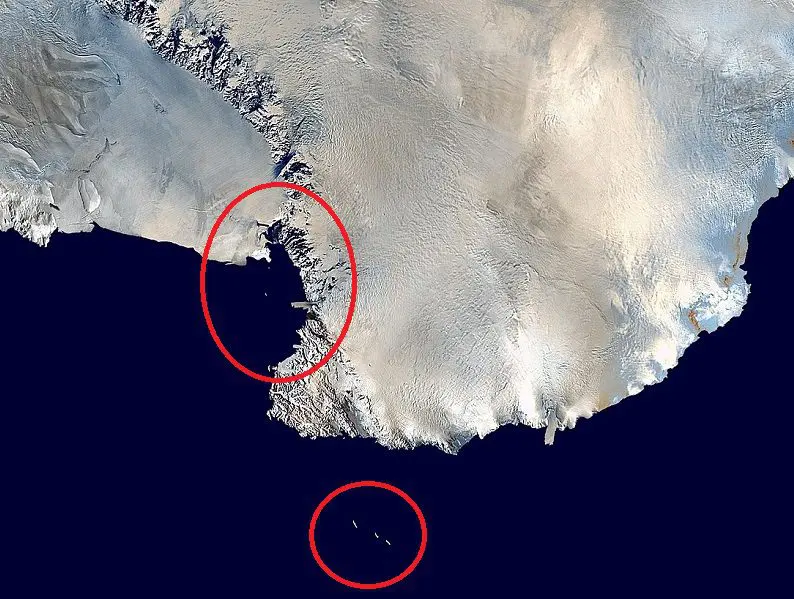

Both capes have the same three swoops on their outer coastline, and both capes have the same three swoops on their inner coasts. Both maps have identical height-to-length ratios, and both have a high spine running their lengths.
Piri Reis shows the cape being 2 1/2 degrees long, while it is actually only ½ degrees long. If they are the same cape, Piri Reis shows it as five times the actual size.
Cape Adare sits at 72º 20¹ South by 170º 18¹ east longitude, which is due south of New Zealand. The Duck Cape shown on the Piri Reis map is due south of the Canary Islands, at 23 degrees west longitude. This is almost on the opposite side of the earth, and the discrepancy would seem to eliminate the possibility that these are the same cape.
However, from my time in the U.S. Navy, I am painfully aware that the opposite bearing problem is the most common error in both radar direction finding and in map making. It is surprisingly simple to transfer a cape on one map onto the opposite side of the world on a new map. So, it is entirely possible that Piri Reis placed the Duck Cape at 1 degree west when he should have transcribed it at 170 east. The other 13 degrees equal only 263 miles at this latitude, which could reflect an error on the source map.
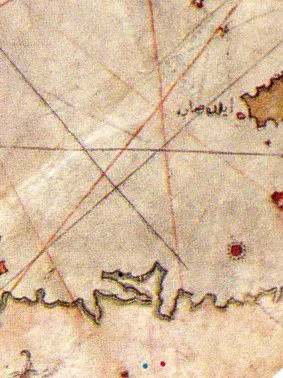
Because the Queen Maud Land mountains are in the correct longitude, the map cannot simply be rotated. However, Piri Reis includes compasses that indicate which land areas were drawn from different maps. The Queen Maud Land islands are drawn from one map, while the cape is drawn from a different source map. That source map is indicated as the source for the Duck Cape and from the cape to another prominent Antarctic cape.
Between them is 24 degrees on the Piri Reis map. This corresponds with the Mertz Glacier cape (NO) on Google Earth. Both maps also show a small thumb off this cape, at 22 degrees west of the Cape. Both maps also show small islands 2 ½ degrees north of this cape, although Google Earth shows them 15 degrees east of where Piri Reis shows them.

Piri Reis also shows a “top hat” on Duck Cape — and this corresponds to the Possession Islands, just off the head of Cape Adare. If the sea level were 300 feet below where it is now, the Possession Islands would be the top hat on Duck Cape. Although Piri Reis shows an ice-free Antarctic coastland, the original map may have been drawn while the continental Ice Age was near maximum, including thick ice in inland Antarctica, but the ice had not yet flowed into the coastal areas. This would also mean that the coastal valleys would be ice free, and many features near Cape Adare would closely resemble the Piri Reis map near Duck Cape.
As one alternative explanation, Antarctica is currently compressed into the earth’s mantle by the miles of ice sitting on it. The Piri Reis source map may have been drawn before the force of the ice had compressed the land into the mantle. Higher land would have the identical effect as having a lower sea level, from the viewpoint of the map makers.
Further information regarding the Piri Reis map may be found in the book Maps of the Ancient Sea Kings by Charles Hapgood. I cannot agree with everything in his book, but he brings together a magnificent collection of Medieval maps showing Australia and Antarctica before modern explorers “discovered” these lands.
I recommend that fellow believers research these maps, which show that Noah’s close descendants built ships and explored the post-Flood world much earlier than any records — except Genesis Chapter 10 — indicate.


Excellent article. I’m glad you explained how different maps were used in the making of this one and how easy it is to flip directions. The idea of Antarctica being higher without the weight of the ice would also explain why the cape is five times larger.
I’ve been comparing ice sheet growth of Greenland to Antarctica. In 50 years, 260 feet of ice was laid on the WWII planes. That is 5 feet per year. At that rate it would take less than 4000 years for the deepest ice to developed on Antarctica.
I like this comment. You are correct that the WWII planes, covered by 260 feet of ice in 50 years, extrapolates to 2,000 feet of ice in Greenland or Antarctica in 4,000 years; this is consistent with the Biblical timelines, and totally unlike the evolutionary timeline. When one considers the massive snowfalls a few years after the Global Flood, the evolutionary timeline is out the window.
The diminishing ice cover in the Arctic regions of the continents is known to be causing the continents to rise – this is well documented in the area of Hudson’s Bay, where a ship repair area has risen 30 feet and is now unusable. This is one of the attractions of the Polar Bear Capital of the world, Churchill, Manitoba, Canada.