Geologists have long recognized that a knowledge of the past history of the earth is fundamental to their discipline. Geological pioneer Nicholaus Steno accepted the Bible’s history as reliable and developed his ideas accordingly.1 Modern secular geology arose when workers such as Hutton and Lyell dismissed biblical history and assumed a different history using the philosophical principle of uniformitarianism—the past has always been similar to the present.2 Traditionally, the science has been split into two parts—physical geology and historical geology.
In recent decades, Christian geologists have again taken the Bible as an eyewitness record of past events and built models by considering how these events would have affected geology.3–5 They appreciate that the Bible describes two global events that greatly impacted the geology of the earth, each of which invalidates the secular assumption of uniformitarianism and an earth billions of years old. Geological models developed from biblical history provide a practical tool to help understand the geology of the earth, and to explore and classify it.
Once a theoretical model has been developed it is necessary to examine the geological evidence and classify that evidence within the model. This will help test and evaluate the usefulness of the model and relate the geology of specific regions on earth to events recorded in the Bible. Fortunately, vast areas of the earth have already been explored in detail and their geological features documented in the form of geological maps. These are readily available for most countries. Here I will briefly describe how geological maps can be used to interpret the geology of an area from a biblical perspective.

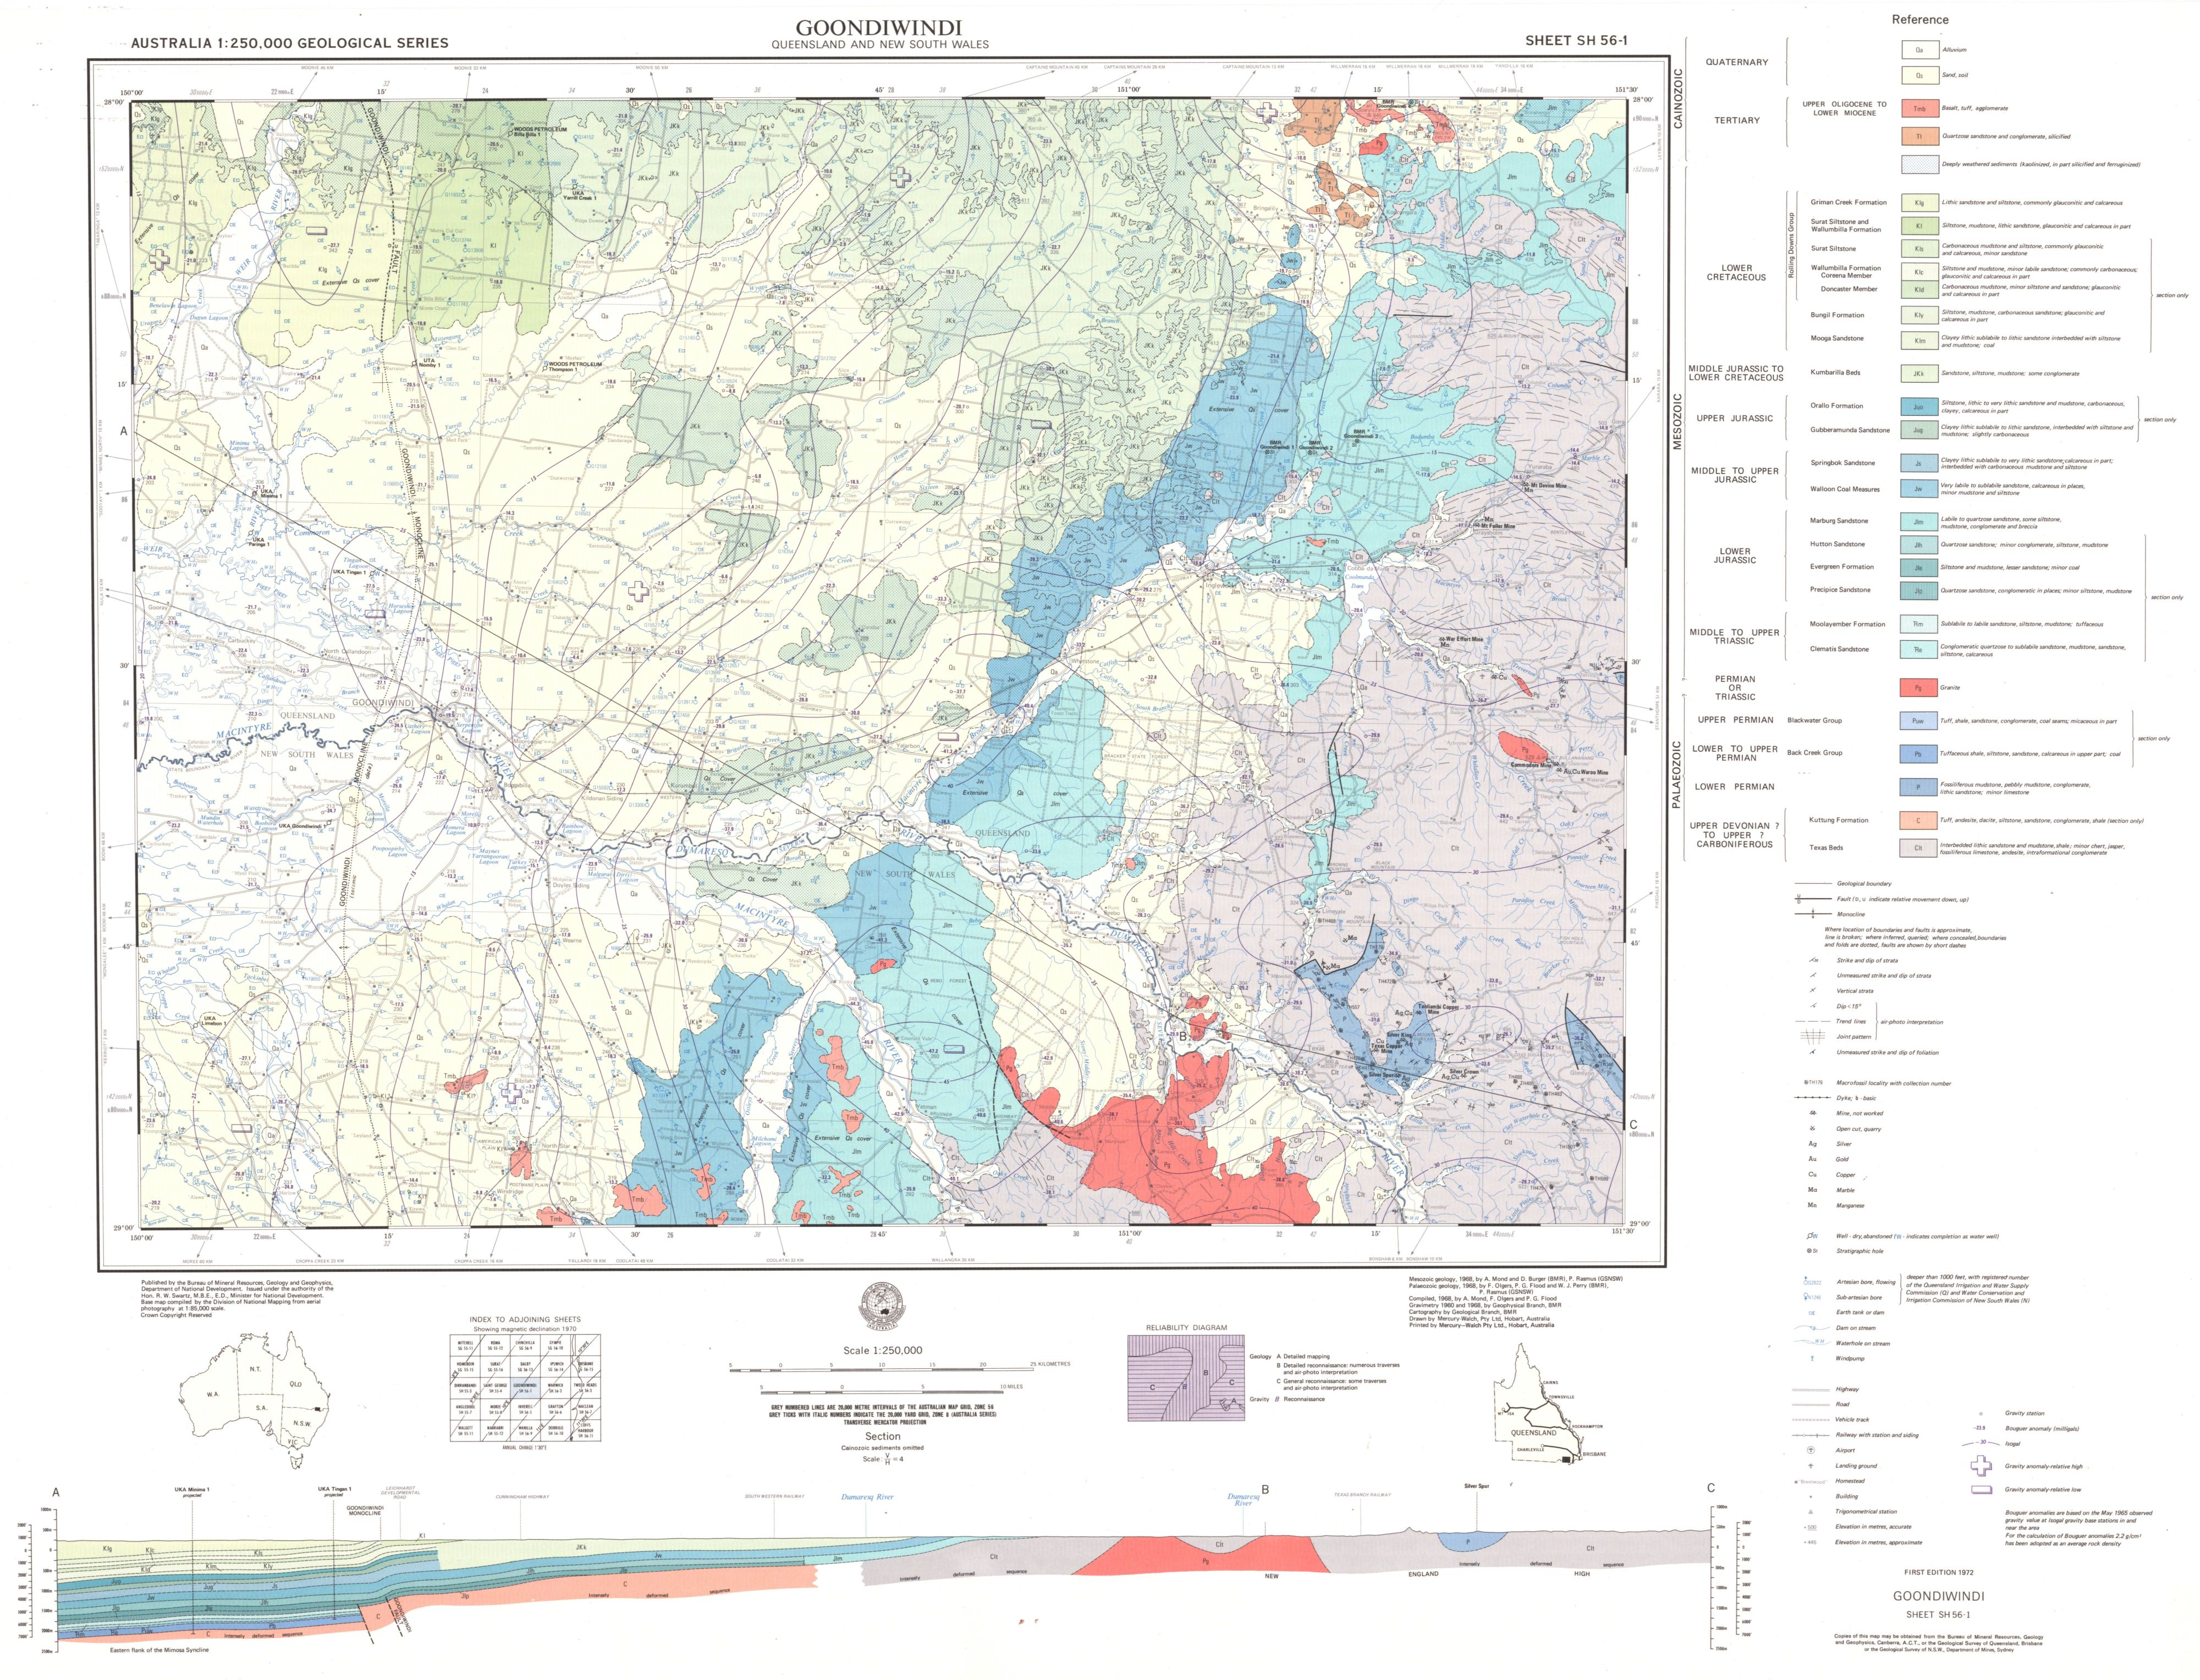
Figure 2. Goondiwindi 1:250,000 geological map. Click for larger image.
Australia 1:250,000 geological map series
In Australia a comprehensive series of geological maps was prepared in the 1960s and 70s as part of a government program, and this has been published as the 1:250,000 scale series (figure 1). These maps can now be downloaded free from the website of Geoscience Australia.6
We need to keep in mind that there can be some degree of subjectivity in the way the geological units shown on the maps are defined but the map provides a good starting point.
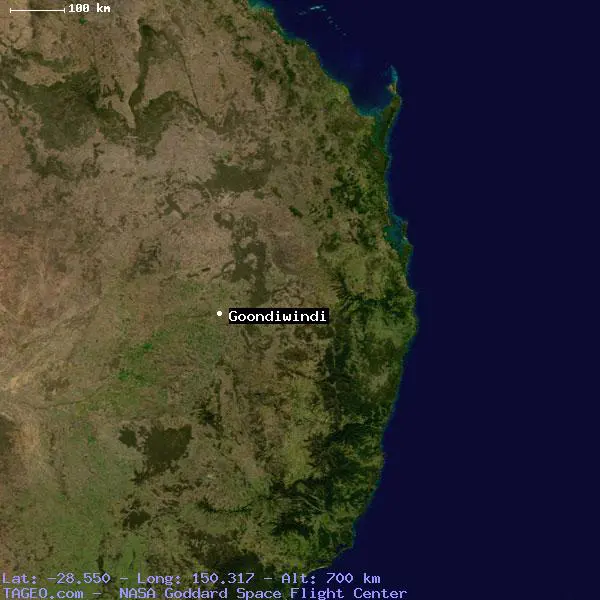
Figure 2 shows the sheet for Goondiwindi (300 km west of Brisbane), Queensland, Australia.7 The information on this sheet is typical of what is provided on each map, with the map itself covering an area about 150 km by 100 km. As usual, the sheet has an interpreted geological cross–section as well as a wealth of other geological material, including the locations of quarries, mines and fossil finds, as well as gravity anomalies.
These maps provide an excellent overview of any area of interest. It is easy to visually scan the whole area of the map and study the cross–section to understand the big picture of what is present geologically. Furthermore, it is a simple matter to refer to adjoining maps and see how the geology extends across the continent. This is exactly what is needed to understand the connection with Noah’s Flood because the Flood was a global event and we can only understand its impact by seeing the big picture. We need to keep in mind that there can be some degree of subjectivity in the way the geological units shown on the maps are defined but the map provides a good starting point.
Connecting with the Flood
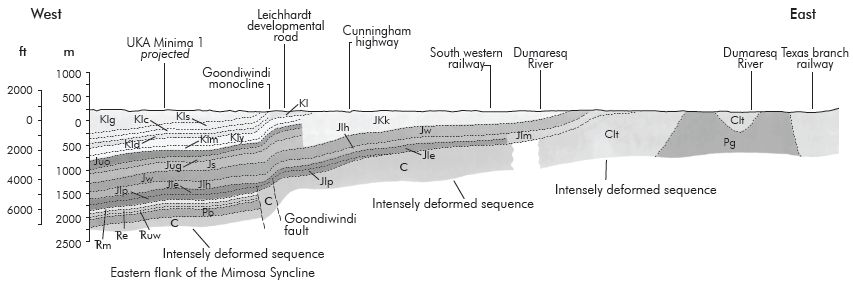

Figure 3. Geological section of Goondiwindi. Vertical exaggeration, v/h = 8. The layers are labelled with letters indicating their names: e.g. the symbol Jlh stands for Jurassic, lower, Hutton sandstone. The first letter refers to the geological system: C means Carboniferous, P = Permian, ![]() = Triassic, J = Jurassic and K = Cretaceous.
= Triassic, J = Jurassic and K = Cretaceous.
The geological cross–section on Goondiwindi extends from west to east. The vertical scale on the section is exaggerated, as it often is, in order that the relatively thin geological layers can be easily seen. Some 75% of the width of the section from the map has been reproduced in figure 3, and the vertical scale has been increased even more than on the sheet, resulting in a vertical exaggeration of 8 times.
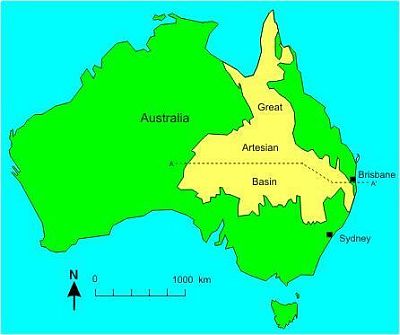
Figure 4. The geographical extent of the sedimentary deposits connected with the Great Artesian Basin.
The need for this vertical exaggeration illustrates the first feature of the sedimentary layers shown on the map—they are relatively thin compared with their lateral extent. This characteristic is something that Ager noted and described as “the persistence of facies”.8 The layers exposed in the Goondiwindi area extend for nearly 2,000 km to the west into the Northern Territory and South Australia (figure 4). Such a vast lateral extent of strata is not a prediction from geological uniformitarianism but it is a prediction for sediments laid down during the global catastrophe of Noah’s Flood: “It is expected that the structures formed during the Inundatory stage would be of continental scale.”9
In figure 3 it can be seen that the sedimentary layers dip down to the west. (The dip looks steep on the section due to the vertical exaggeration but in the field it dip is quite gentle.) Note the strata sit on a ‘basement’ (consisting of sedimentary and volcanic deposits) that is described as “intensely deformed”.10 In other words, there is a clear geological demarcation between the sedimentary strata and the geological unit underneath. The total thickness of all the sedimentary layers is more than 2 km at the western end of the section.
A detailed analysis of the geological characteristics of these strata using the classification criteria within the biblical geological model concluded that they were deposited during the first part of Noah’s Flood—the Zenithic phase.11
That is, these sediments were deposited as the waters of the Flood were rising and just before they reached their peak. This conclusion was based on the expectation that the movement of water during the global Flood would have spread the sediment over vast geographical areas (the scale criterion). Another factor was the presence of footprints and trackways. Certain strata in these layers contain footprints of dinosaurs, temporarily stranded as they tried to escape, which means the layers were deposited before the waters had reached their peak and all air-breathing animal life had perished (Genesis 7:20–24).

Concerning the deformed sediments and volcanics beneath the strata, one possibility is that they could have been deposited during Creation Week. However, these strata contain fossils, which is why they have been classified on the map as Carboniferous (labelled with a C). Fossils mean that these sediments were also deposited in the Flood during an earlier phase. It also indicates that significant tectonic activity occurred during the first part of the Flood deforming the sediments after they were deposited.
Geological maps can be used to develop an authentic geological history of the area that fits within the biblical perspective.
Another feature that helps synchronize the geological section to the biblical Flood is the location of the existing land surface. As the floodwaters drained into the ocean they initially flowed in vast sheets which, as the water level reduced, eventually developed into huge channels. This period was primarily an erosional event on the continents, and it is expected that the present landscape was mostly formed at this time: “During the Recessive stage the waters moved off the continents into the present ocean basins. This was a highly erosive process.”12 Holt called this period the “Erodozoic”.13
When we examine the horizontal land surface that runs across the section we can assume that it was mainly carved during the Recessive stage of the Flood. Of significance is the way the geological strata intersect this present land surface. On the cross–section it can be seen that, as the strata rise upwards to the east, they have been truncated at the land surface. This means that the thick strata extended much further to the east and that they have been eroded away. The enormous area of land surface affected and the quantity of material removed is a feature consistent with the global Flood.
Conclusion
A preliminary examination of the geological cross–section for Goondiwindi (figure 3) illustrates how geological maps can reveal the sequence of events occurring during Noah’s Flood. The readily available maps provide an excellent overview. Of course these preliminary ideas need to be checked and tested for consistency with other geological details, such as the information available in field guides, map commentaries, research papers and field reconnaissance. But this analysis shows that geological maps can be used to develop an authentic geological history of the area that fits within the biblical perspective. As these connections between geology and the Bible are made more widely available to the general community it will affect the way people view the world.